Where People go - Migration in 2017
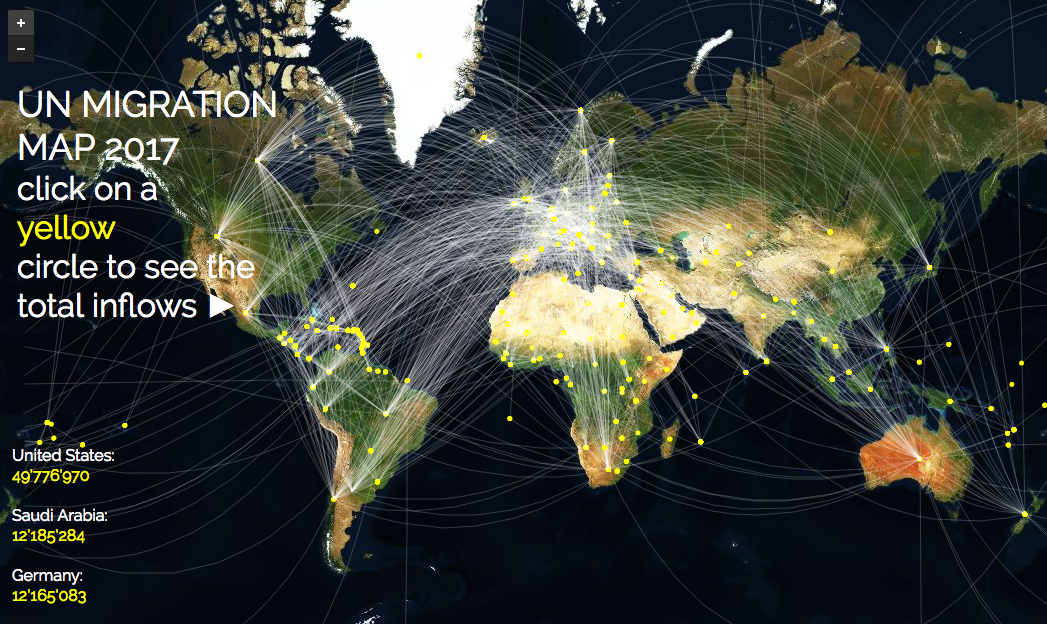
I used data from the United Nations Population Division about migration in 2017 to create this map here with Mapbox and Leaflet. The data has been preprocessed in Python and the country centroids were fetched with the rgeos library in R. All the code can be found here. Click here to explore the entire map. I hope to perform a network analysis on the migration pattern to see what distribution the degrees are following. What we see here might be a power law :)
subscribe to the tag via RSS