Swiss Waterways
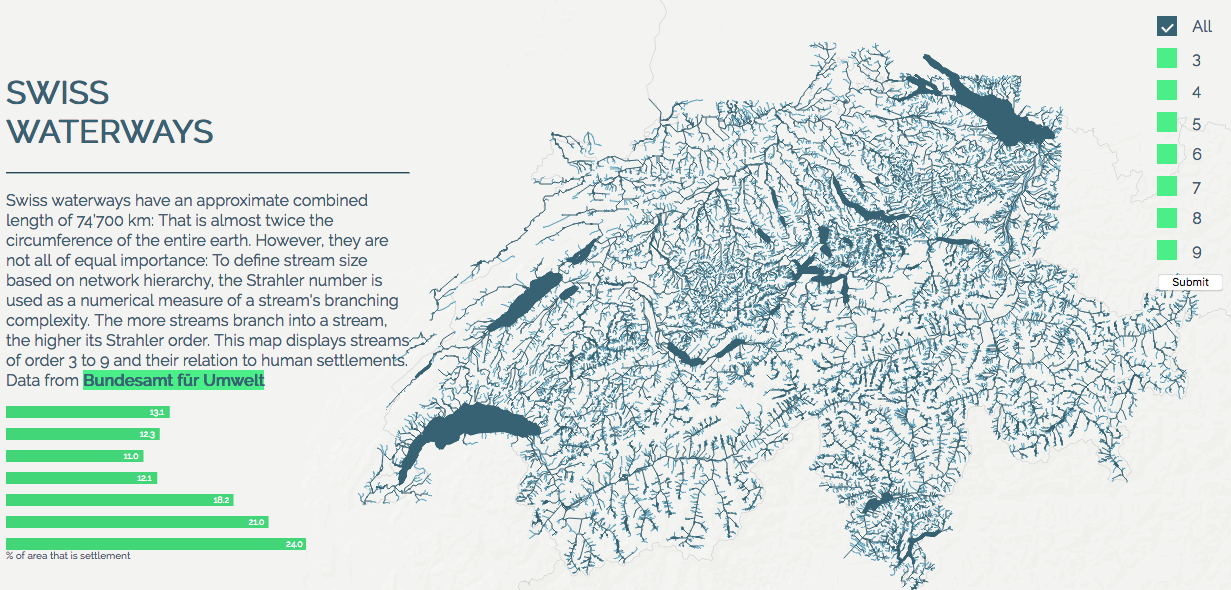
This project aims to depict the complex structure of Swiss waterways and how human settlement density relates to a stream’s Strahler order in an interactive web map. To define stream size based on network hierarchy, the Strahler number is used as a numerical measure of a stream’s branching complexity. The more streams branch into a stream, the higher its Strahler order.
Data
The dataset of the Swiss waterways can be obtained from the Federal Department of
Environment (BAFU) as a Shapefile. The lakes of Switzerland were retrieved from a
separate dataset also created and maintained by BAFU and added to the map for
orientation purposes. In order to quantify settlement density adjacent to each Strahler
group from 3 to 9, a Shapefile containing census data aggregated per Canton (state)
was retrieved from the Federal Department of Statistics.
Methods
Prior to the transformation of the Shapefile into an SQL format, the waterways data is
simplified and dissolved in QGIS. The roughly 250’000 different stream segments are
consolidated into the nine hierarchical Strahler orders they belong to in order to
minimize the file size. To further reduce the size, the lake Shapefile and all streams
of an order lower than 2 are loaded into a background template map onto the
Mapbox server. The entire project is subdivided into five different files:
- rivers.sql holds the waterways data,
- db_connection.php establishes a connection with the database,
- mapdata1.php holds the php code required to query the SQL database and transform the queried data into a Geojson,
- maplogic.js prepares the map and all related map features using the Leaflet library,
- mapbase.php holds the HTML framework / a JavaScript D3 barchart,
- mapstyle.css contains all created or adapted CSS styles
By using the PostgreSQL extension PostGIS, the waterways of Strahler order 3 to 9 are transformed into the SQL database rivers.sql. This method was chosen in order to store the spatial line features in an efficient manner. The terminal command
shp2pgsql -I -s 4326 file.shp tablename > file.sql
transforms the Shapefile into an SQL table with an additional geometry field. A PostGIS geometry is a representation of a geographical object used to perform fast and efficient data manipulation using Well-Known Binary (WKB) encoding1. In the SQL query that is part of the mapdata1.php file, the encoding is decoded using the following PostGIS/SQL functions:
st_asgeojson(pg_escape_string($geomfield))
As an extension, a ‘WHERE’ clause is added to the query depending on which Strahler order the user chooses in an HTML form. The entire SQL in mapdata1.php query looks like this (simplified to demonstrate the method):
SELECT fields st_asgeojson($geomfield) AS geojson FROM geotable WHERE floz=$input;
After connecting to the database using the code in mapdata2.php and fetching the selected data based on the query, the data is reformatted into a Geojson format that can be interpreted by JavaScript. This part of the php code is based on a code from Bryan McBride that can be found on his Github profile2. In the maplogic.js file, the mapbase from Mapbox is loaded in by creating a new Leaflet tilelayer using
L.tilelayer()
The waterways Geojson created in mapdata1.php is loaded in by using the function
L.geojson()
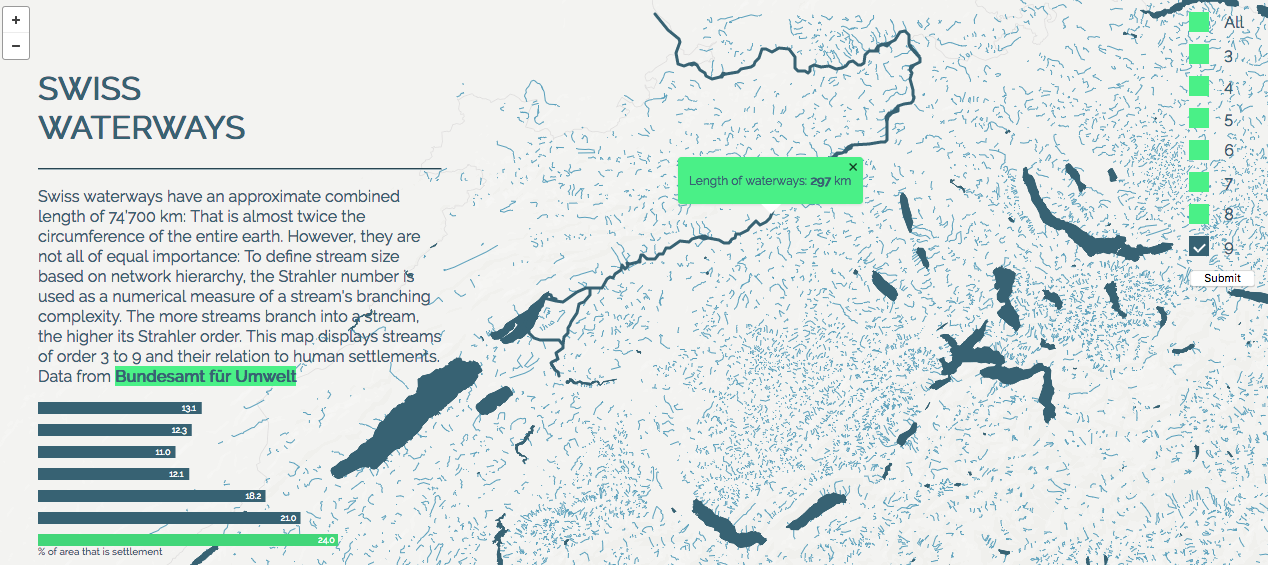
Maplogic.js also specifies the line attributes and implements a popup displaying the total length of each Strahler group as well as a color-changing function if the mouse hovers over a stream. Lastly, the mapbase.php loads all dependencies and renders all the content using HTML and the CSS style specifications from mapstyle.css. An important feature is the HTML submit form where the user can input what Strahler order he or she wishes to see. The selected input value is fed into the query in the mapdata1.php file. Mapbase.php also includes a small JavaScript snippet for a D3 barchart to display the settlement percentage for each Strahler group from 3 to 9. In order to obtain the settlement percentages, a selection based on location was performed in QGIS to select all canton polygons that each consolidated Strahler group intersects with. For each selection, the mean of the percentage of land that is covered by human settlements is calculated.
Results, limitations and further development
The interactive web map was tested on Chrome, Firefox and Safari and renders
without errors in all three browsers. The web map is currently not responsive and
therefore only works on computer displays. In a next step, the content could be made
suitable for mobile devices and tablets. The map achieves to provide an overview of
the complex water network in Switzerland and effectively communicates how higher
Strahler orders lead to a higher percentage in settlement adjacent to the waterways.
In further developments, this relationship could be explored further by directly
projecting the dense areas onto the map. Much of the development was dedicated to load the complex SQL data within a reasonable time. When lower Strahler orders are
queried it takes roughly 5 seconds for the map to load. While loading, the screen is
white expect from the message ‘connection successful, please wait’. This transition
should be improved by implementing a loader or by using other methods to load large
and complex datasets, such as raster tiles.
Query a PostGIS table:
https://gist.github.com/bmcbride/1913855
PostGIS and PostgreSQL:
http://www.postgresonline.com/journal/archives/267-Creating-GeoJSON-Feature-Collections-with-JSON-and-PostGIS-functions.html
Federal Department for Environment (BAFU):
https://www.bafu.admin.ch/bafu/de/home/themen/wasser/zustand/karten/einzugsgebietsgliederung-schweiz/nutzung-gewaesserbezogener-umweltdaten.html
https://www.bafu.admin.ch/bafu/de/home/themen/wasser/zustand/karten/einzugsgebietsgliederung-schweiz.html
Federal Department of Statistics (BFS):
https://www.bfs.admin.ch/bfs/de/home/statistiken/bevoelkerung.html
subscribe to the tag via RSS
« Where People go - Migration in 2017
Can we use Machine Learning to predict building functions? »